
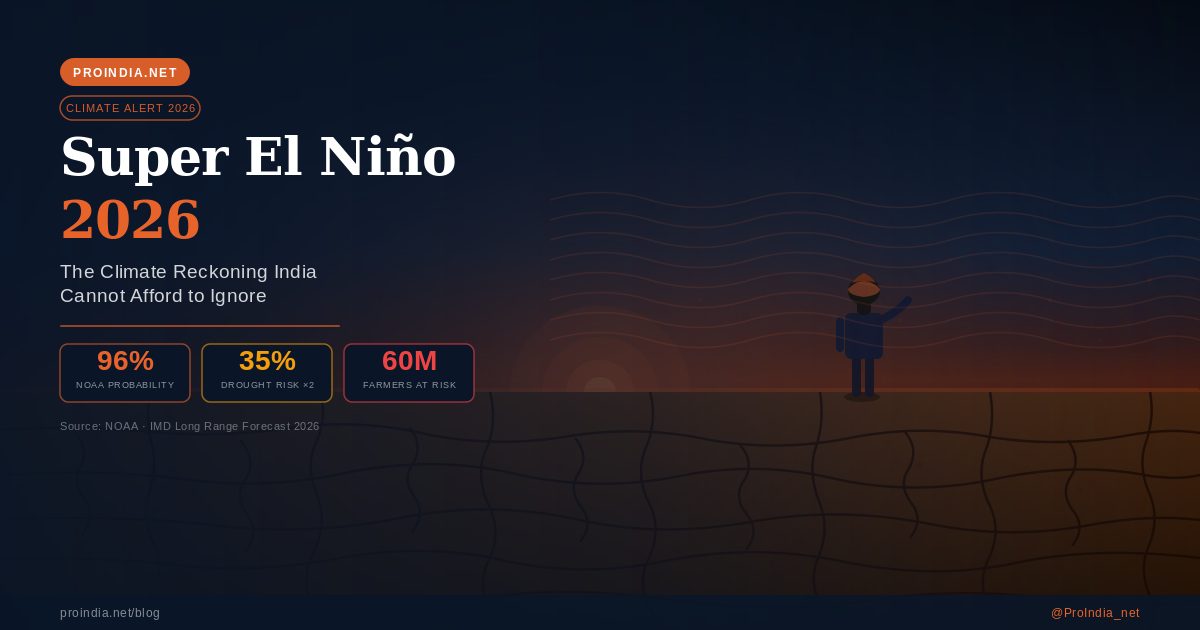
Ninety-six percent. That is the probability NOAA has now assigned to a full Super El Niño developing by December 2026. I have been watching this number climb all year, and what it means for India’s farmers, businesses, and food system is something most people are not talking about — not seriously, anyway.
This is not a fringe forecast. Every major climate modelling agency on the planet is saying the same thing. And this one is different from anything we have seen before, because it is arriving into a world that is already carrying +1.5°C of human-caused warming on top of whatever the Pacific throws at us. The combination is new. The risks are larger.
So let me lay out what is actually happening — the science, the India-specific numbers, the human cost from past events, and what you can realistically do about it.
What Is El Niño — And Why Does “Super” Change Everything?
Every few years, a band of unusually warm water spreads across the central and eastern Pacific. This is El Niño. It disrupts atmospheric circulation worldwide — trade winds weaken, the jet stream shifts, rainfall patterns reorganise around this new heat source. Most events are moderate. The world absorbs them, recovers, moves on.
A Super El Niño is a different animal. It kicks in when sea surface temperature anomalies exceed +2°C above normal across the Pacific. At that threshold, the effects are not just bigger — they are exponential. Monsoons collapse. Multi-year droughts begin. Wildfires tear through continents. Floods arrive in places that were bone-dry three weeks earlier.
Only three Super El Niño events have ever been recorded: 1982–83, 1997–98, and 2015–16. We are likely entering the fourth. And it is happening on a planet that is already hotter than those three ever were.
Pacific Ocean Temperature Record
Sea Surface Temperature Anomaly: 1980–2026
Three confirmed Super El Niño peaks (1983, 1998, 2016) and the emerging 2026 event. Source: NOAA / Climate.gov
The Science, Without the Jargon
Here is what is actually happening in the Pacific right now, and why it matters for someone sitting in Mumbai or Hyderabad.
Under normal conditions, trade winds push warm water westward across the Pacific — away from South America, toward Asia. That warm pool sitting near Australia and the Bay of Bengal is essentially the engine that powers India’s monsoon. It generates the moisture and convection that becomes rain over the subcontinent from June to September.
When El Niño develops, those trade winds weaken — sometimes reverse. The warm water sloshes back east. The engine that drives our monsoon loses fuel. The result: a weaker, delayed, or deficient monsoon across South Asia. The stronger the El Niño, the worse the shortfall.
Normal Year — India gets its rain
Trade winds blow warm water westward toward Australia and the Bay of Bengal. This warm pool fuels India’s monsoon. Result: strong June–September rainfall across most of India.
El Niño Year — India’s monsoon engine stalls
Trade winds weaken or reverse. Warm water migrates east toward South America. India’s monsoon engine loses its fuel source. Result: deficient or failed monsoon across multiple states.
Key insight: When the warm pool migrates east, India loses the moisture engine that drives its monsoon. The stronger the El Niño, the greater the deficit. A Super El Niño does not just weaken it — it can suppress it almost entirely for an entire season.
What 70 Years of Data Actually Show for India
I want to be specific here, because “India’s monsoon may be affected” is a sentence that people read and forget. Let me give you the numbers instead.
Looking at every El Niño year from 1951 to 2022: in 60% of those years, India got below-average monsoon rainfall. Not slightly below. Meaningfully below — the kind that forces crop failures, drives up food prices, and empties reservoirs. The 2015–16 Super El Niño pushed India’s monsoon to just 84% of the Long Period Average. Entire kharif seasons were written off in Maharashtra, Karnataka, and Rajasthan.
For 2026, the India Meteorological Department’s long-range forecast already shows overall monsoon at 90% of LPA, with an 84% probability of below-normal or worse rainfall from June to September, and a 35% probability of a fully deficient monsoon. The historical average for that last number? Sixteen percent. We are at more than double.
And 60% of India’s farmers depend on this rain for their single most important crop.
Monsoon Risk Analysis
India Deficient Monsoon Probability: 2026 vs. Historical
IMD defines “deficient” as rainfall below 90% of Long Period Average — the threshold at which widespread crop failures begin. Source: IMD 2026 Long Range Forecast
States at highest El Niño drought risk this season: Maharashtra · Karnataka · Andhra Pradesh · Odisha · Gujarat · Rajasthan · Madhya Pradesh · Telangana
In 60% of El Niño years since 1951, India got below-average monsoon rainfall. This year, the drought risk is more than double the historical average. And 60% of India’s farmers are staking their entire season on it.
What Happened the Last Three Times
Projections only land when you see what actually happened before. So here is the human record — not forecasts, not models, but events that occurred and were documented.
The 2016 El Niño: 100,000 people died in wildfires across Southeast Asia and South America. 60 million people required emergency food assistance across Africa, Asia, and Latin America. Research from Nanyang Technological University in Singapore found that each Super El Niño episode cuts global life expectancy by 0.5 years per person.
For India specifically in 2026, food inflation from crop failures is already projected to rise by 0.4%. That sounds small. But 50 to 60% of a low-income Indian family’s monthly expenditure is food. A 0.4% spike is not a statistic for that family. It is a meal removed from the week.
Historical Record
The Human Cost of Super El Niño Events — Three Decades of Evidence
| Event | Deaths | Food Aid | Economic Loss | Life Expectancy |
|---|---|---|---|---|
| 1982–83 Super El Niño |
20,000+ | Tens of millions | $2.6 trillion | –0.5 years |
| 1997–98 Super El Niño |
20,000+ | Millions across Asia, Africa, LatAm | $4.7 trillion | –0.4 years |
| 2015–16 Strongest on record |
100,000 (wildfires) | 60 million | $35T by 2100 | –0.5 years |
| 2026 → Developing now |
Depends on preparation | 60M+ farmers at risk | Food inflation +0.4% | TBD |
Sources: NOAA, United Nations, NTU Singapore, PreventionWeb, World Weather Attribution
Compound Risk
Why 2026 Is Different: El Niño Peak Plus Rising Global Baseline
Each Super El Niño now arrives on a warmer planet. The baseline keeps rising. 2026 starts from a higher floor than any of its predecessors. Source: NOAA, NASA GISS
El Niño Is Natural. What We Have Done to It Is Not.
This is the part I want to be direct about, because it matters for how we respond.
El Niño has existed for millennia. It is a natural feature of the Earth’s climate system. The Pacific has always oscillated. But the severity of what we are now seeing is not just the Pacific being the Pacific. A warmer baseline ocean — warmed by 150 years of fossil fuel combustion — means more energy available to intensify every El Niño that comes along. When the Pacific then adds another +2°C on top of a global baseline that is already +1.5°C above pre-industrial levels, the total thermal anomaly is something the planet has not experienced in the modern record.
In 2023–24, this combination pushed global temperatures above the 1.5°C Paris threshold for the first time in recorded history. Not for a century. For one year. But it happened. And the data shows it will happen again, for longer, with each cycle.
The choices made over 150 years of industrialisation did not create El Niño. But they have ensured it keeps arriving stronger, more destructive, and more expensive every single time.
What You Can Actually Do — Before the Season Peaks
The 90-day window before peak monsoon season is still open. Here is what it looks like in practice.
If you run a business
- Map monsoon-linked supply chain exposure this week — not in August when the damage is already visible.
- Shift at least one procurement stream to local, circular sources before kharif season peaks.
- Redirect CSR from plantation photo-ops to farmer resilience: crop insurance, water harvesting, drought-tolerant seed programs.
- Have an honest internal conversation about your organisation’s carbon exposure — as risk management, not compliance.
If you are an individual
- Reduce food waste. Forty percent of India’s food is lost post-harvest. In a drought year, that waste compounds the crisis.
- Switch to seasonal, local produce. Import-dependent supply chains are the first to crack when a monsoon fails.
- Understand your water consumption. Groundwater recharge is India’s first line of defence when surface water drops.
- Know your household carbon footprint — then pick one thing to reduce this month, not next year.
At the policy level, India needs a standing El Niño agricultural contingency plan that activates automatically on IMD early warnings — not a reactive scramble after crops fail. Water harvesting and groundwater recharge need to move from political slogans to funded infrastructure. And the carbon conversation needs to shift from “is this real” to “how fast can we move.”
The question is not whether India can survive this. We have survived El Niños before. The question is whether we use 2026 as the inflection point — the one that finally makes climate understanding and climate action move at the same speed.
Amit Saha is the founder of ProIndia.net — working at the intersection of sustainability, circular economy, EPR, and climate resilience for India’s businesses and communities.
→ Subscribe to the ProIndia Climate Brief — practical climate risk intelligence for Indian businesses, fortnightly and free: proindia.net/climate-brief
References: (1) NOAA — Super El Niño 2026 probability forecast (2) IMD — 2026 Long Range Monsoon Forecast (3) WMO — Climate alerts Q1 2026 (4) NTU Singapore — “El Niño events reduce life expectancy, cause trillions in economic losses” (5) Down to Earth — Super El Niño 2026 India monsoon analysis (6) Business Standard — “Super El Niño 2026 threat grows” May 2026 (7) PreventionWeb — El Niño health impacts (8) World Weather Attribution — Pre-monsoon heat in South Asia